Visualizing Big Data – The First-Ever Tableau Workshop

The concept of using pictures to visualize data has been around for centuries – from maps and graphs to pie charts. Technology has advanced the concept to an even higher level and has lit the fire under data visualization, according to Master of Business Analytics (MBAN) Program Director, Murat Kristal.
“Computers made it possible to process large amounts of data at lightning fast speeds,” Professor Kristal said. “Today, data visualization has become a rapidly evolving blend of science and art that is certain to re-shape the corporate landscape over the next few years.”
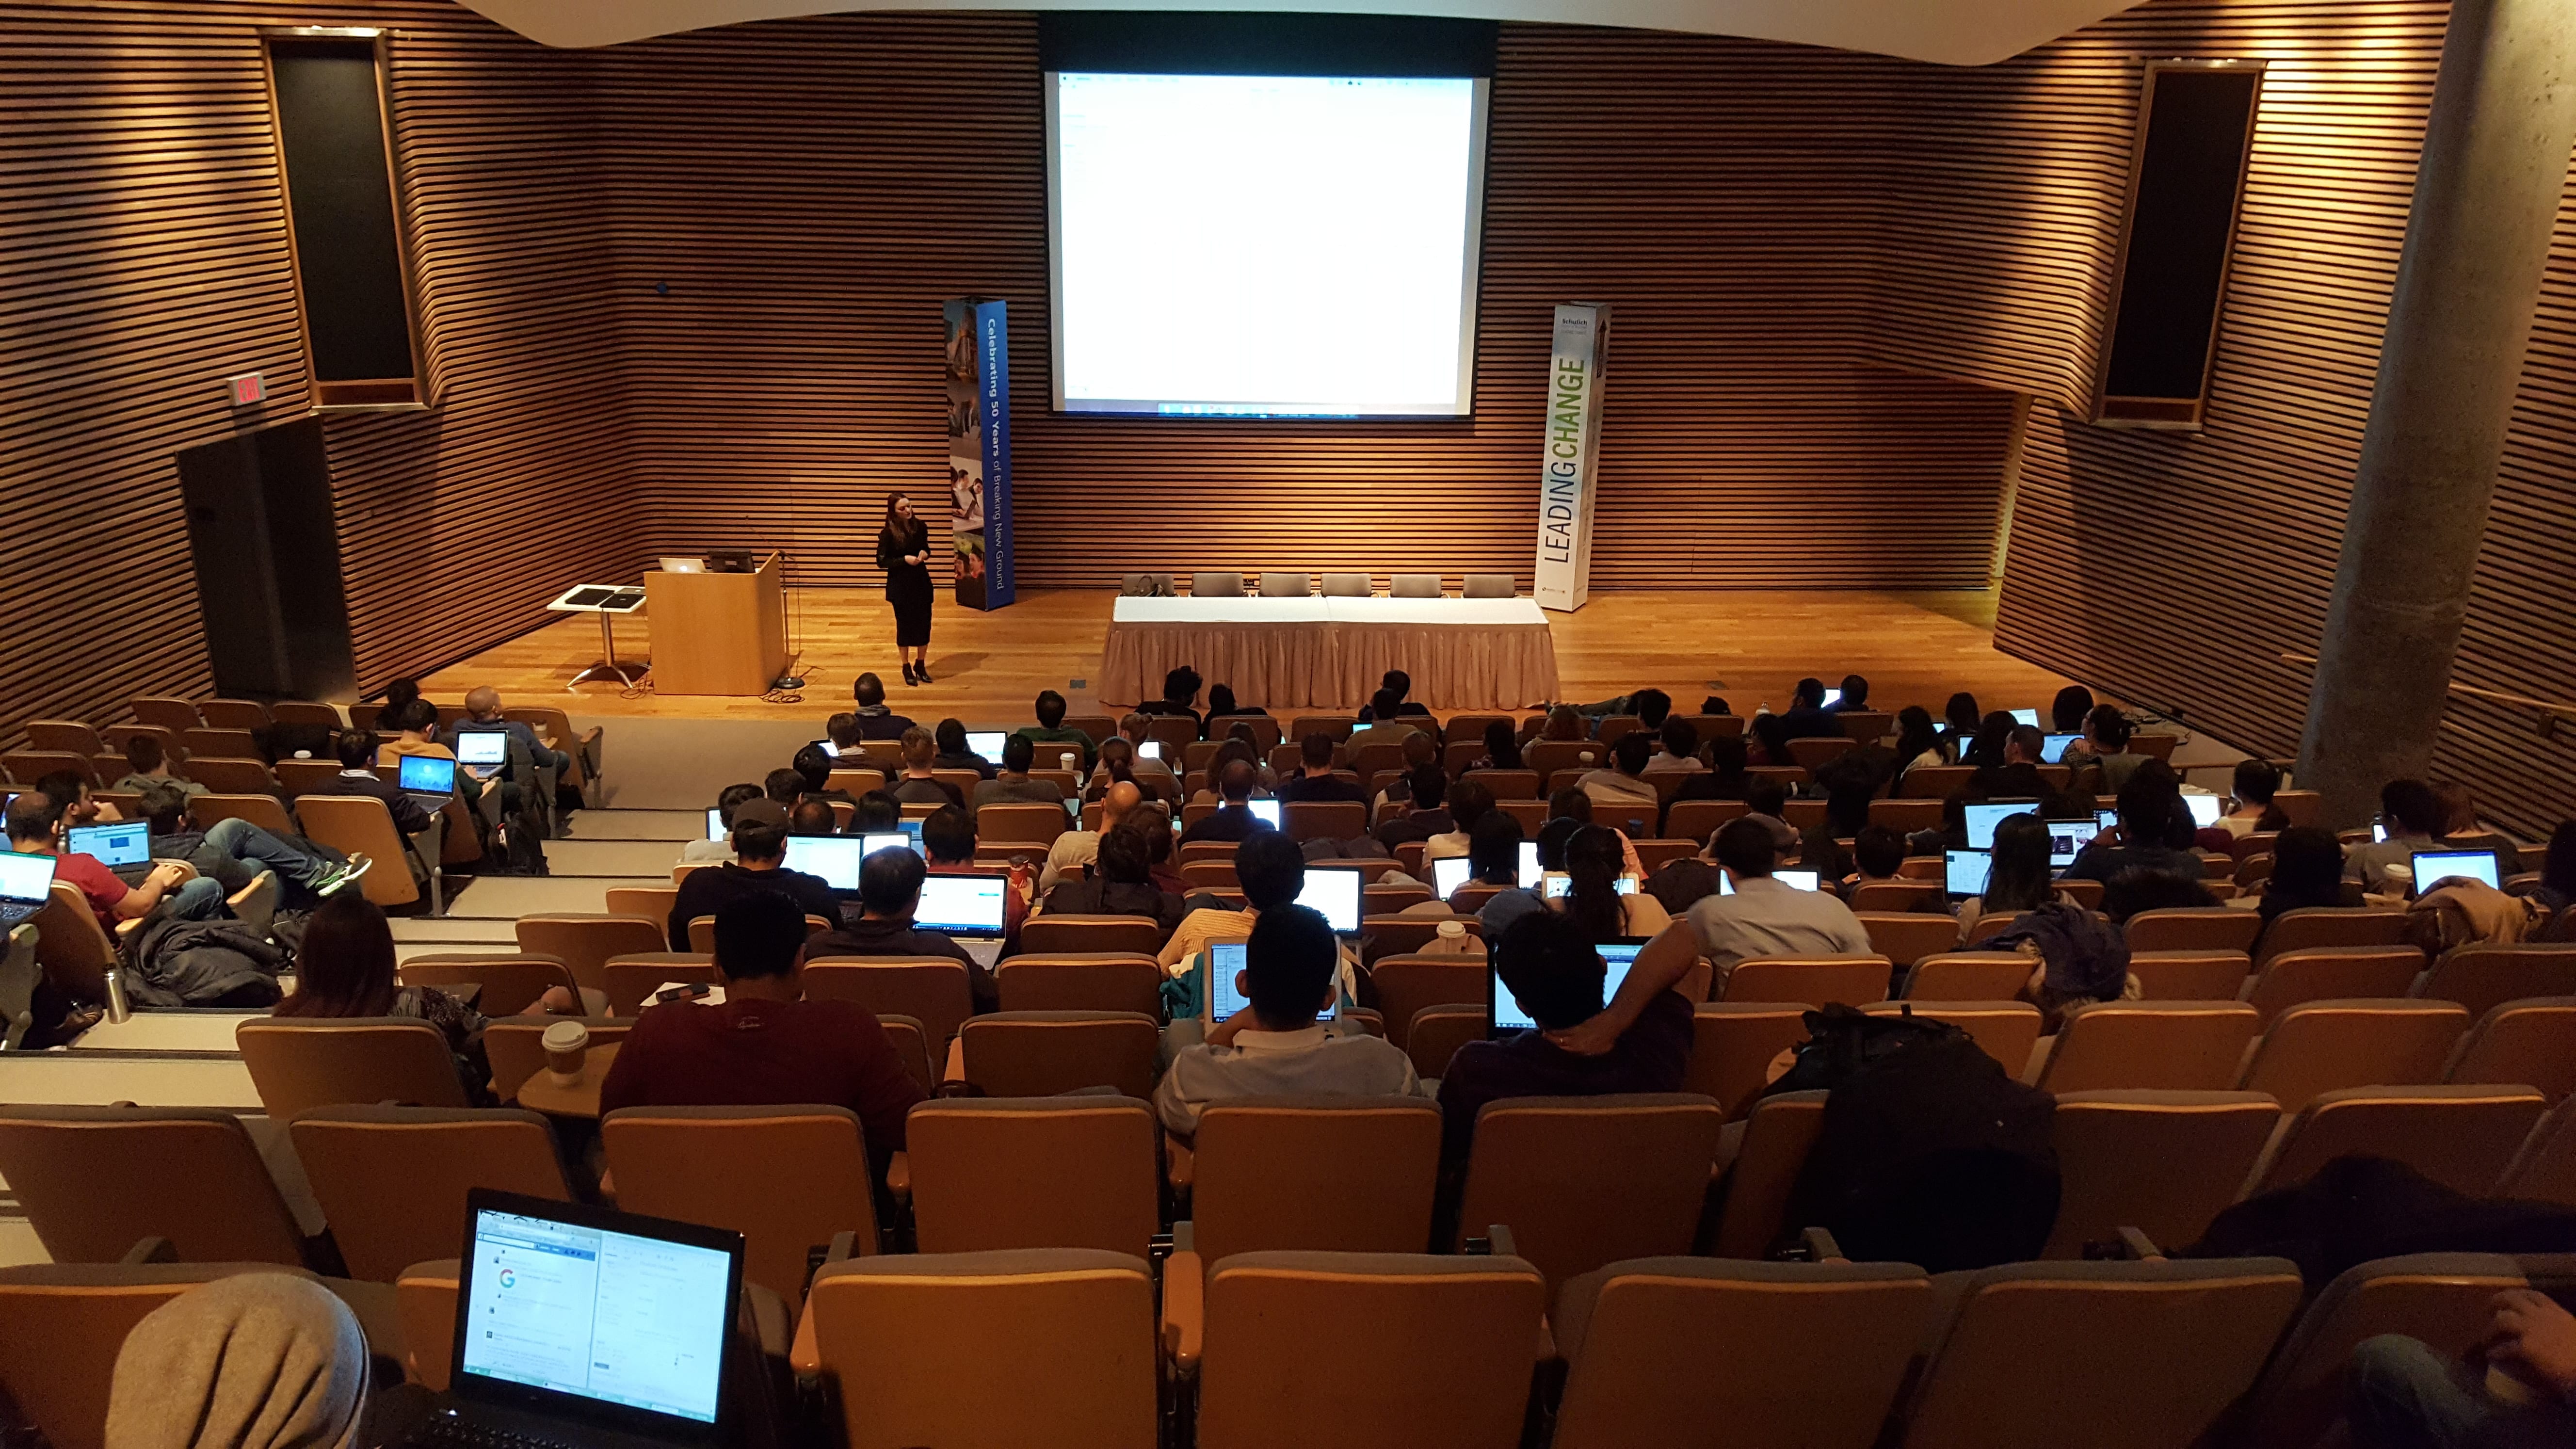
In part with Schulich’s MBAN program, the school’s recent Tableau Workshop gave over 150 graduate students the opportunity to learn firsthand how to take Big Data and create visual analytics using Tableau’s industry-leading business intelligence software.
“Using charts or graphs to visualize large amounts of complex data is easier than poring over spreadsheets or reports and conveys the concepts in a universal manner,” said Professor Kristal.
Brandi Gutfriend, Sales Consultant at Tableau, led the workshop. In her role she is witnessing the increased popularity of data visualization software and sees a growing trend for students from different specializations entering the workforce to be fluent in creating visual analytics.